
by M. Vera and I. Manzo – SGS MINERALS – CONSULTING
Geometallurgy implies a long-term commitment to optimize value and minimize risk. However, it can also be used to do short term focus.
Traditional approaches consider mainly grades and qualitative characteristics as control parameters to link ore properties and process as an intent to integrate geology attributes and metallurgical responses.
On the other hand, advanced approaches aim at linking mineralogical information (viz. lithology, alteration, mineralization) and metallurgical performances (i.e., beneficiation efficiency) as part of an ore control strategy to support unit operations (short-term) and mine planning (long-term).
Well-integrated information allows process and decision-making to be optimized based on the generation of applicable knowledge in a contextual manner. Nonetheless, it is fundamental to achieve a comprehensive understanding of the data which requires reliable acquisition, robust interpretation, holistic integration and specialized analysis of it [1].
It goes without saying that the mining process relies on the management of the heterogeneity of value, which is distributed across the different particle sizes that host it. Consequently, a good understanding of the value (i.e., chemical composition and liberation degree) of different particle size classes is essential to make business decisions.
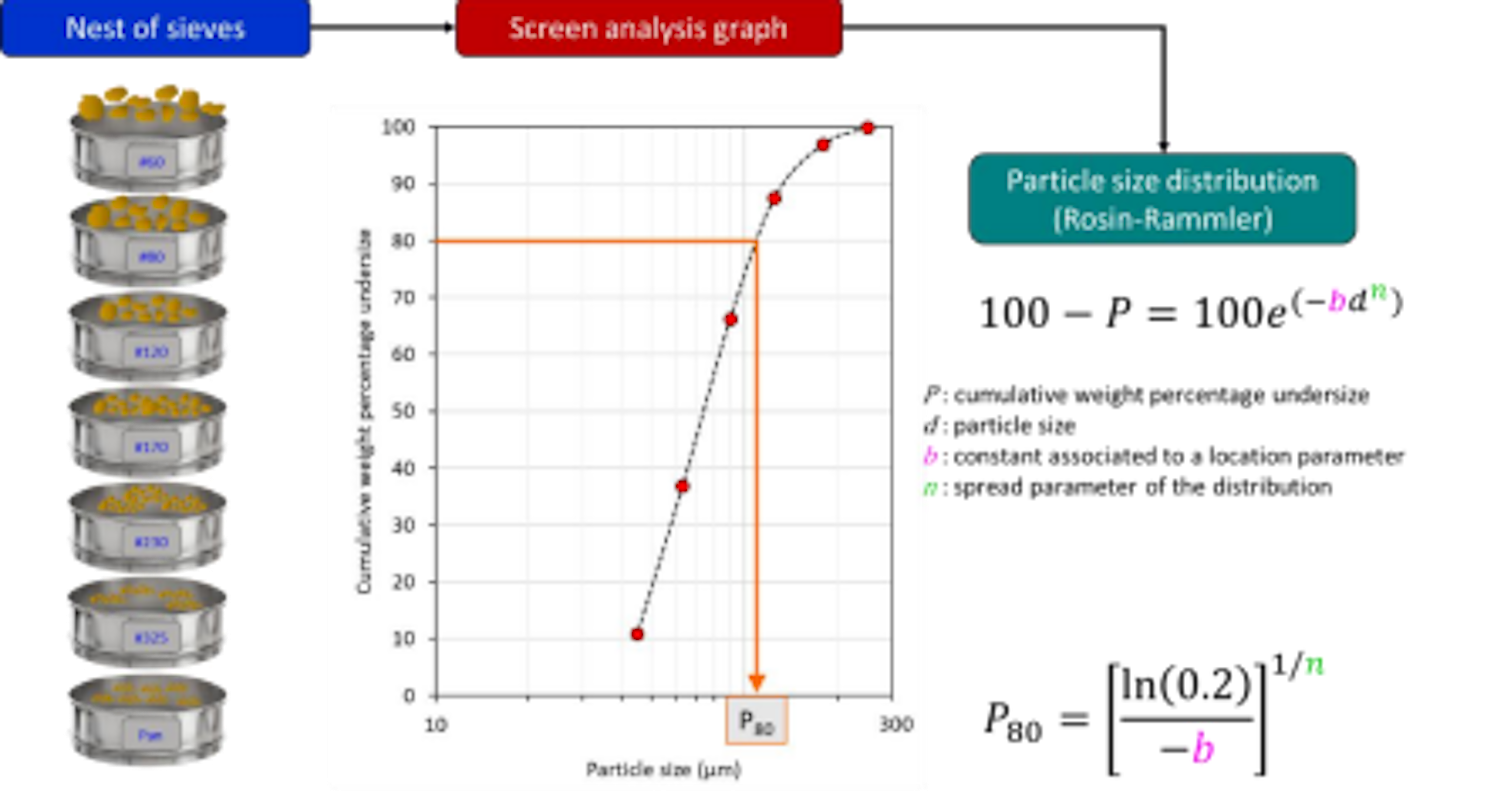
Diagram of the ore particle size distribution
Figure 1 illustrates a diagram of the standard analysis that is carried out to describe the particle size distribution of an ore sample [2]. Firstly, the sample is separated out by screening using a standardized nest of sieves to classify the material at different size classes.
The oversize material at each sieve is weighed to generate a screen analysis graph. Having obtained this information, it is possible to work out the cumulative weight passing percentage as a function of particle size. This data can then be smoothed by fitting the well-known Rosin-Rammler (RR) distribution (see Figure 1).
Note that the RR distribution is defined by two parameters, viz., n and b. These parameters help determine the position and spread of the distribution [3]. By adjusting the Rosin-Rammler distribution to the experimental particle size distribution data, the size associatedto80%cumulative passing can be determined, which is known as P80 parameter.
Data processing workflow
As indicated in the previous blog [4], a well-structured workflow is needed to process the data and extract valuable information by multivariate analysis. In order to define a short term geometallurgical approach to bringing about applied knowledge out of particle size distribution information over time.
For example, figure 2 shows a data processing workflow for the feed particle size distribution analysis of a processing plant. It can be observed that the workflow starts off with raw data generated from particle size tests.
This information is processed by sorting, classifying, and filtering methods to create a principal dataset which includes feed particle size analysis, and bulk copper chemical composition. Then, screen analysis is conducted to estimate the cumulative passing percentage.
Afterward, experimental errors and error propagation are determined for the size analysis results. To continue along, particle size distributions are described by the Rosin-Rammler distribution, which allows P80 parameter to be estimated.
With this information, it is then possible to perform a hierarchical cluster analysis, defining size classes over time as attributes. Finally, a holistic analysis is carried out of the attributes and responses (i.e., particle size distribution and bulk copper chemical composition) of each cluster identified.
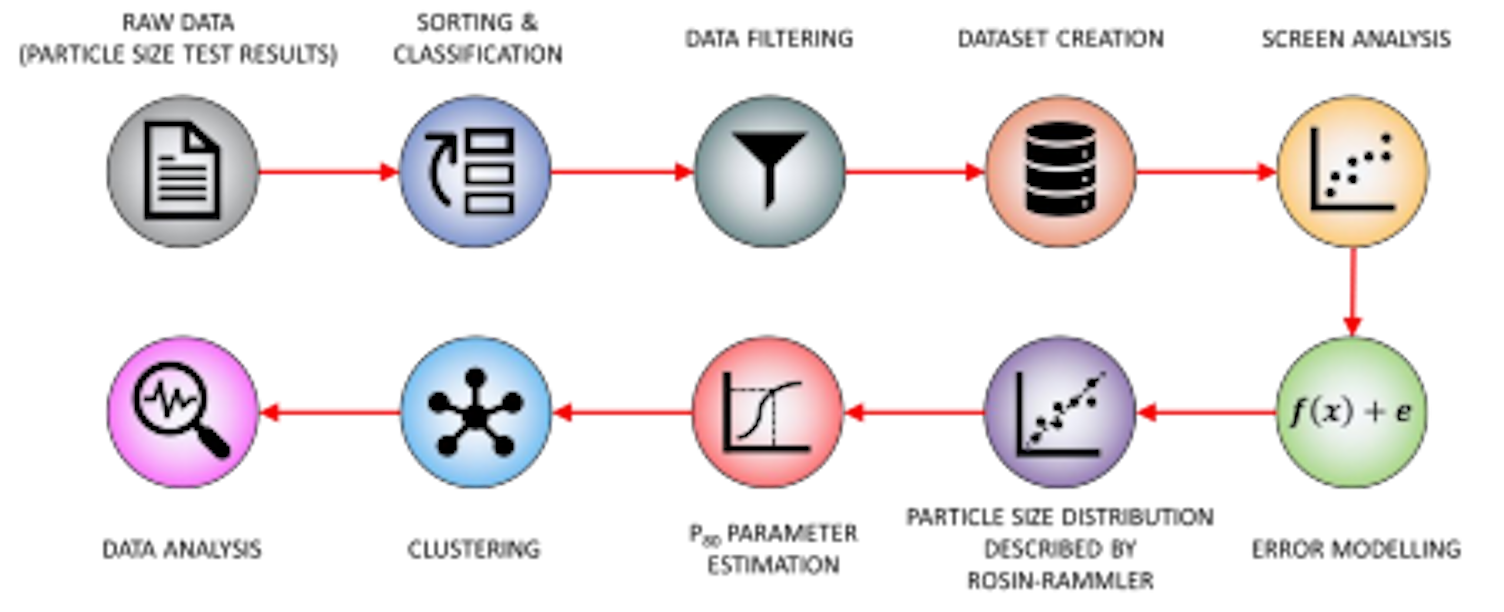
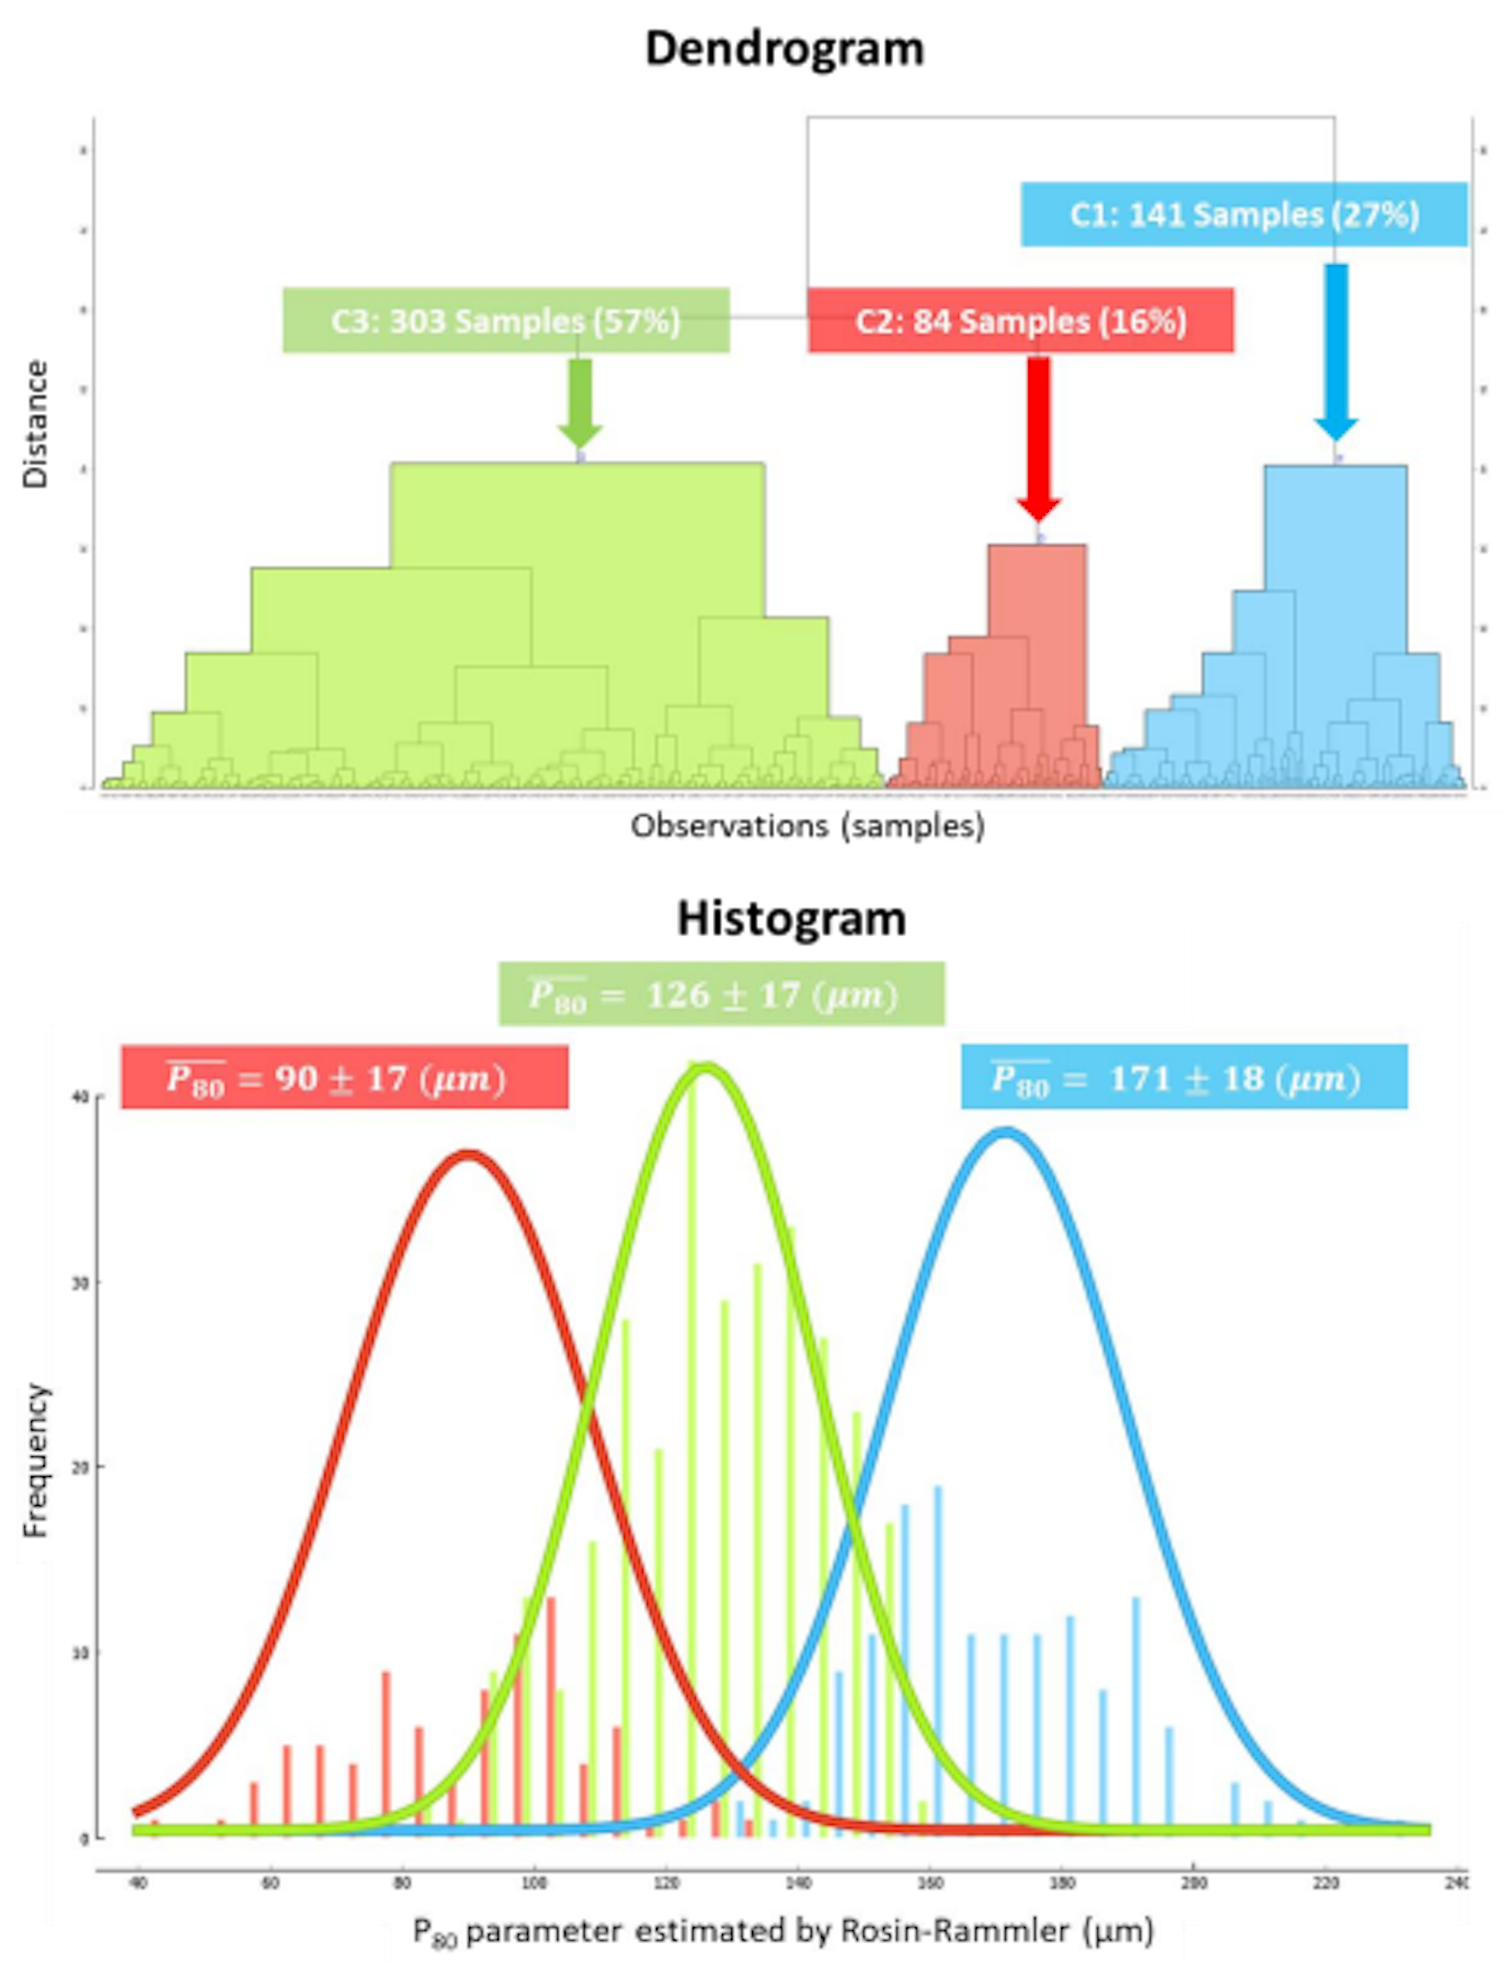
Figure 3 shows the dendrogram and histogram resulting from the hierarchical cluster analysis performed on particle size distribution data by SGS. This is part of a consulting case study aim at analyzing feed particle size distribution data (historical feed process data for 2022).
Dendrogram results show that three clusters were identified. In addition, histogram results depict mean P80 values associated to the identified clusters, viz., 90, 126, and 171 (µm).
Note that the histogram uncertainties for the different clusters are 19%, 14%, and 11%, respectively. These findings allow a simple interpretation to be proposed which can describe as 27% of the data appear to be the harder material, 16% of the data represent the softer material, and 57% of the data has medium level of hardness.
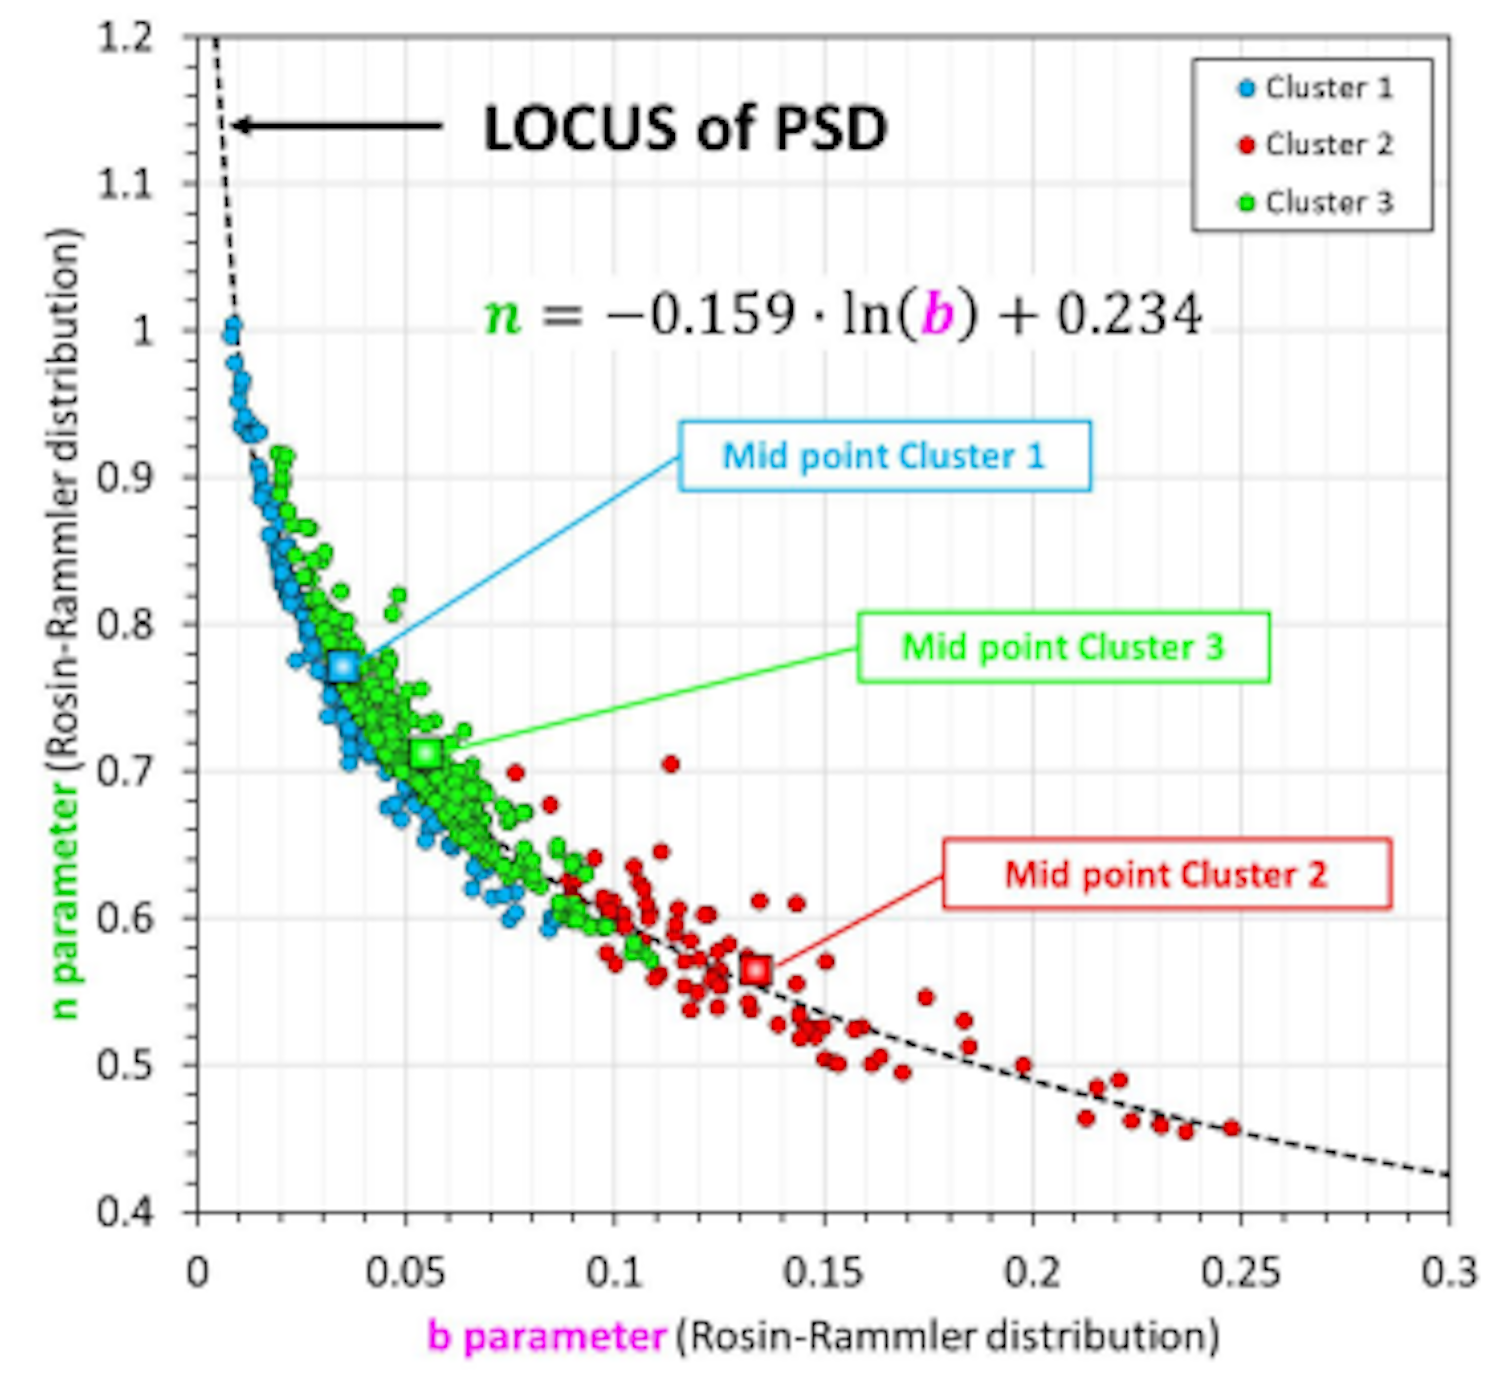
An interesting finding of this multivariate analysis has got to do with the relationship identified for the Rosin-Rammler distribution parameters, i.e., n and b.
This relationship defines a particle size distribution locus which indicates the set of all points whose location is determined by stated conditions (i.e., type of blending, feed into the comminution stage, comminution, and classification process).
Figure 4 illustrates the locus of particle size distribution (PSD) for a process feed material collected over one year. Note that all PSD data can be summarized with one single curve. In other words, by defining n and b out of this curve, the complete particle size distribution can be generated within the above-mentioned stated conditions. The empirical equation derived for the relationship between n and b parameters is also showninFigure4.
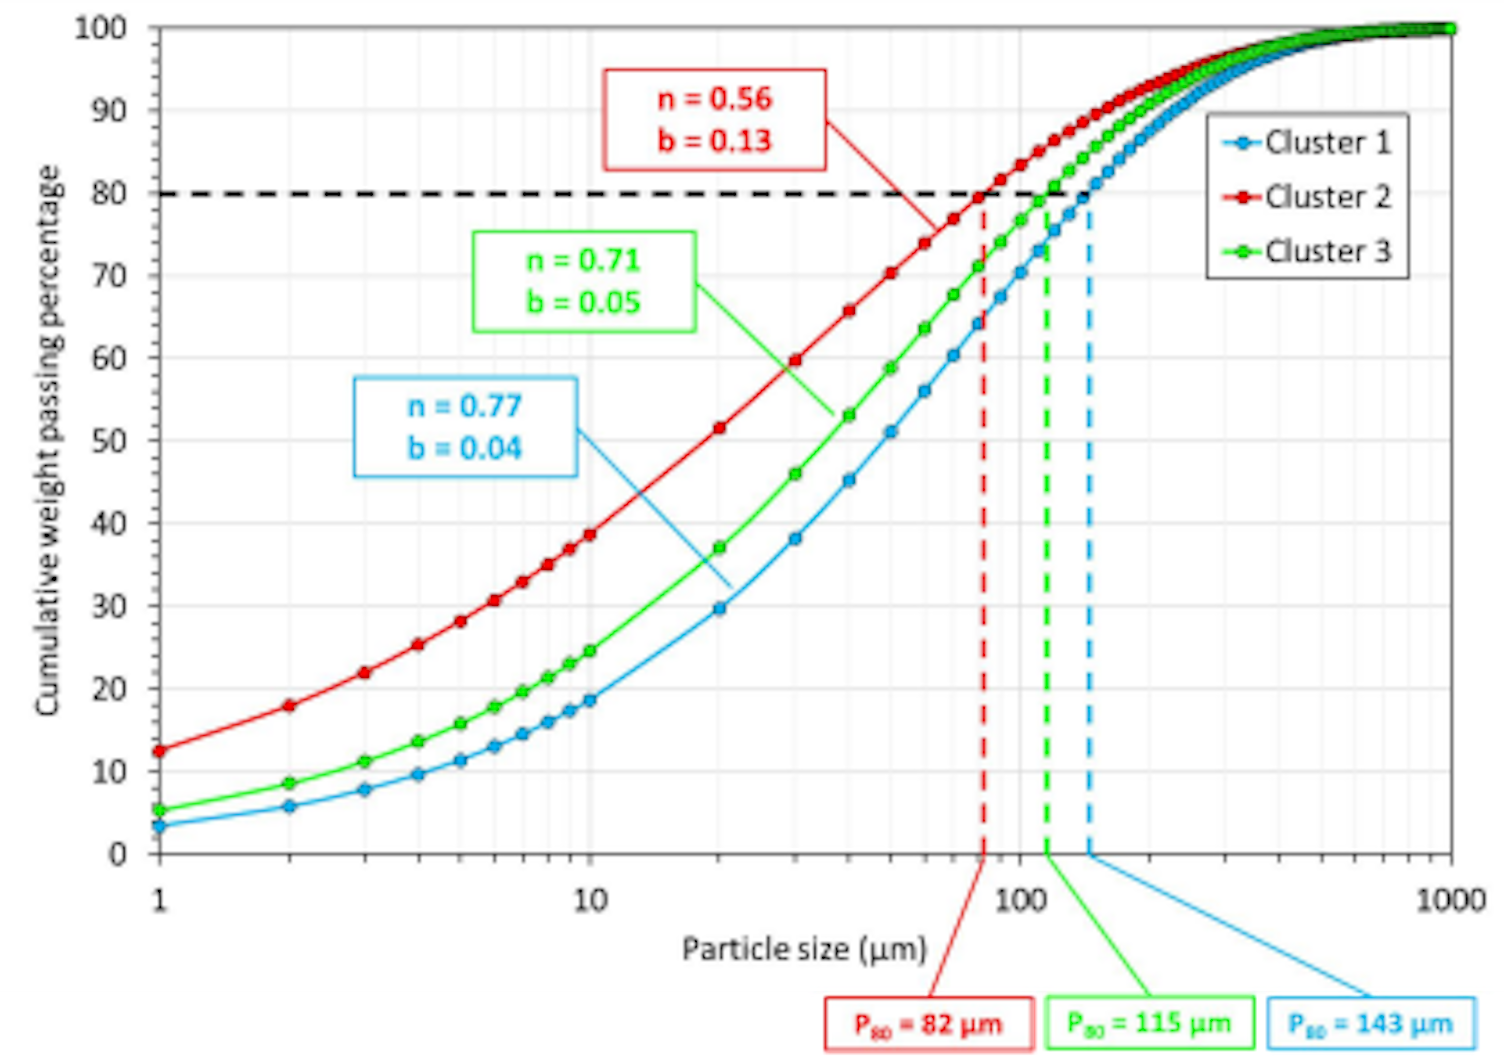
Figure 5 depicts the particle size distributions estimated using the average values of n and b parameters. Note that each cluster produces different average values of the Rosin-Rammler parameters, which are related to the grouping criteria used to generate the dendrogram (see Figure 3 and Figure 4).
At the same time, these criteria can be associated to the particle size variability of the ore samples, because of the variability of ores properties in terms of their hardness and grindability.
Specifically, the estimated particle size distributions show similar trends in comparison with the histogram resulting from the hierarchical clustering, i.e., clusters present P80 values representing high, medium, and low level of hardness.
Concluding remarks
SGS geometallurgical strategy allows different approaches to be accommodated. Specifically, this contribution focused on a short term geometallurgical initiative to analyze process operating data with the purpose of transforming experimental data into applied knowledge.
Three important aspects of this blog can be highlighted:
- Particle size results over time allow an understanding of PSD to be established contextually.
- A definition of a well-structured workflow helps identify the stages to be conducted to extract the applied knowledge associated to the particle size distribution gathered data.
- The multivariate analysis and the Rosin-Rammler described particle size distribution did help establish a PSD locus, which in turn may provide a holistic approach to assess the influence of ore hardness on particle size distribution variability.
References
- Dominy, S. C. et. al. (2018). “Geometallurgy—A Route to More Resilient Mine Operations”. Minerals 2018, 8, 560.
- Wills, B. A. (2009). “Wills' Mineral Processing Technology”. Elsevier Science & Technology Books. SeventhEdition.
- Alderliesten, M. (2013) “Mean Particle Diameters. Part VII. The Rosin-Rammler Size Distribution: Physical and Mathematical Properties and Relationships to Moment-Ratio Defi ned Mean Particle Diameters”. Part. Part. Syst. Charact. 2013, 30, 244–257.
- Vera, M., Manzo, I. (2023) “Procesamiento de Datos en Aplicaciones Geometalúrgicas – Caso de Estudio: ClusteringJerárquico en Análisis de Resultados de Flotación”. SGS Perú Blog. https://www.sgs.com/es-pe/noticias/2023/03/aplicaciones-geometalurgia.
About SGS
We are SGS – the world’s leading testing, inspection and certification company. We are recognized as the global benchmark for sustainability, quality and integrity. Our 97,000 employees operate a network of 2,650 offices and laboratories, working together to enable a better, safer and more interconnected world.


Whatsapp for service requests only
Av. Elmer Faucett,
3348,
Callao, Peru